Surge in Utility-Scale Installations Drives US Solar Deployment to 11.7 GW in Q3 2025
Module prices declined by 12% YoY across all segments
December 9, 2025


Follow Mercom India on WhatsApp for exclusive updates on clean energy news and insights
The U.S. solar industry added a capacity of 11.7 GW in the third quarter (Q3) of 2025, a 20% year-over-year (YoY) and a 49% quarter-over-quarter (QoQ) increase, according to US Solar Market Insight Q4, a joint report by Wood Mackenzie and Solar Energy Industries Association.
The report attributes the rise in solar installations to nearly completed projects in Q2 that were halted by the Reconciliation Act and completed in Q3. However, it highlighted that industry constraints and supply chain bottlenecks moderated the installation rush.
The quarter also saw solar module shortages and delivery delays affecting the residential sector. The commercial and community solar projects were constrained by labor availability.
The report noted that supply and labor constraints together limited utility solar buildout despite a near-term rush to complete projects.
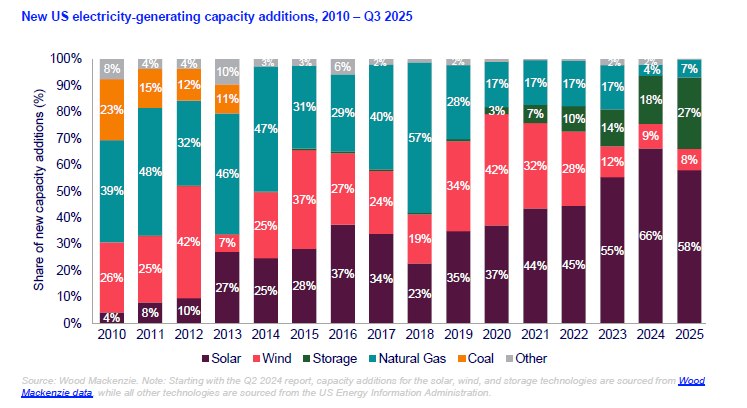
Solar accounted for 58% of all new electricity-generating capacity added in the U.S. in Q3 2025, with 30 GW added. Solar-plus-storage solutions accounted for 85% of new power-generating capacity added during the period.
The U.S. added 4.7 GW of solar module manufacturing capacity in Q3, bringing the total to 60.1 GW. A new wafer manufacturing facility went online at Corning, Michigan.
Segment-Wise Installations
The distributed solar segment saw a mixed quarter, while the utility-scale solar segment saw substantial build-out.
The residential segment added 1,088 MW of solar capacity, a 4% YoY and QoQ drop. Despite a rush to complete projects before this year to qualify for tax credits, equipment constraints held back growth in installations.
The commercial solar segment grew 9% YoY, with 554 MW of added capacity, but declined 12% YoY QoQ. The report highlighted that there were healthy installations in California as the pipeline of Net Energy Metering 2.0 installations continued to come online in the quarter, but the policy-driven surge began to wane.
Under the community solar segment, the U.S. installed 267 MW, a 21% YoY drop and a 12% QoQ jump. The growth in the community solar segment was due to the first projects in New Mexico and Delaware coming online.
The utility-scale solar installations totaled 9.8 GW in Q3, a 26% YoY rise and a 68% increase from the previous quarter. Overall, installation activity for utility-scale projects was concentrated in Texas, California, and Utah. Even though installations grew strongly, contracting activity continued to decline as developers maintained a cautious “wait-and-see” approach.
In Q3 2025, 4.1 GW DC was contracted, representing a 27% YoY decrease.
System Prices
Module prices declined by 12% YoY across all segments, driven by the expansion of manufacturing capacity and higher module capacity power.
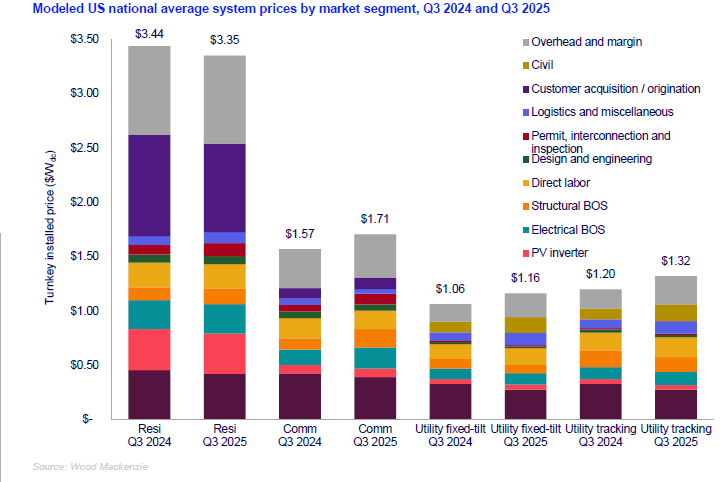
Residential system prices fell 3% YoY to $3.35/W. However, the increase in the balance of cost categories offset the gains from the decrease in the module and inverter process.
System pricing for the commercial sector rose by 9% to $1.71/W. The jump in system pricing for the commercial sector was due to a 50% YoY surge in the cost of balance-of-system electrical systems and racking.
Utility-scale fixed-tilt system costs increased by 9% to $1.16/W DC, while single-axis tracking systems increased by 10% to $1.32/W DC YoY. This price increase is driven by the balance of electrical system costs, which rose 8% YoY due to new tariffs on commodities.
Labor costs also increased by 15% annually, and engineering, procurement, and construction overhead costs and margins jumped by nearly 40%. The surge in labor costs and EPC overhead costs reflected heightened project risk premiums amid policy and tariff uncertainty.
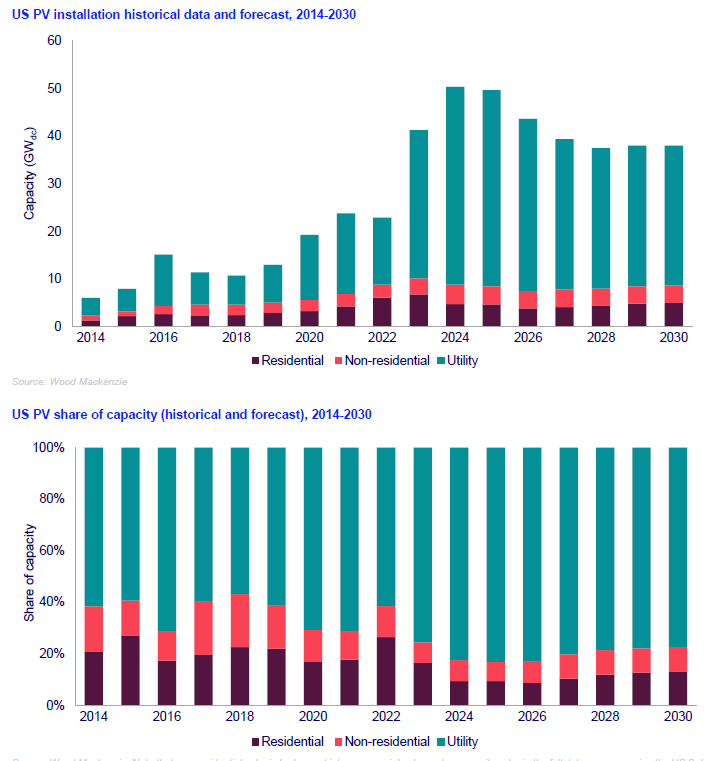
Outlook
The report forecast 246 GW of solar installations between 2025 and 2030. It anticipates 41 GW of utility-scale solar projects to be constructed in 2025 and 197 GW of utility-scale solar to be built between 2025 and 2030.
The U.S. solar industry installed 7.5 GW of capacity in Q2 of 2025, a 24% YoY and a 28% QoQ decline. It installed 10.8 GW of capacity in Q1.


Melvin Mathew
More articles from Melvin Mathew.