US Solar Installations Fall 28% in Q2 2025 Amid Challenges from Policy Shifts
The segment experienced a 24% YoY decline in Q2 2025
September 15, 2025
Follow Mercom India on WhatsApp for exclusive updates on clean energy news and insights
The U.S. solar industry installed 7.5 GW of capacity in the second quarter (Q2) of 2025, a 24% year-over-year (YoY) and a 28% quarter-over-quarter (QoQ) decline, according to Wood Mackenzie and Solar Energy Industries Association‘s US Solar Market Insight report.
The report stated that all segments, except commercial solar, saw capacity additions declining. The commercial solar segment witnessed a strong project pipeline that continued to come online under California’s former net metering regime.
Utility-Scale and Commercial Solar
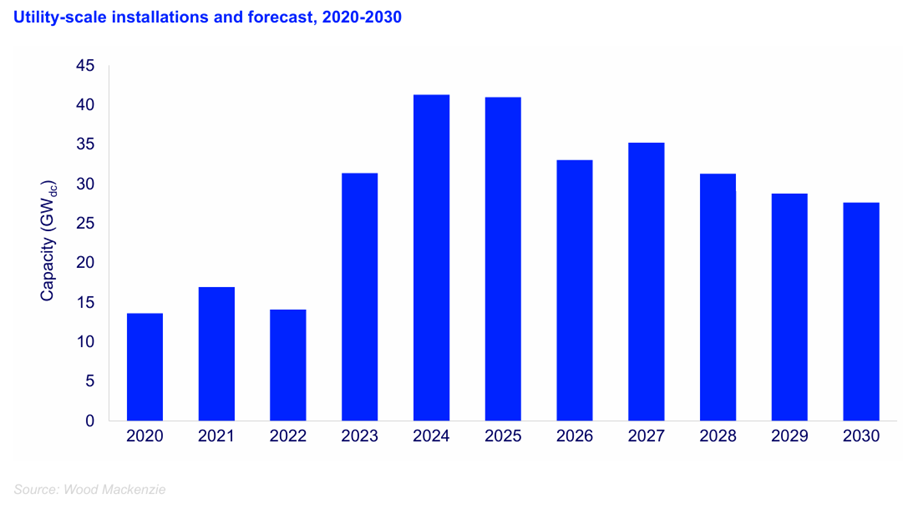
In Q2 2025, installations in the utility-scale segment stood at 5.7 GW, declining 28% YoY and 33% QoQ. In 2024, average solar prices earned by projects in Texas, the largest utility-scale solar market, declined by 50% from 2023.
In 2024, average power prices earned by solar projects were down over 50% YoY. This decline affected the economic viability of new projects. Contracting across the U.S. also declined. The country signed 4.5 GW of new capacity in Q2, a 26% YoY.
Solar projects in New York supported contracted volumes. The New York State Energy Research and Development Authority executed agreements for more than a dozen large-scale projects in May. These projects contributed to over 2 GW of clean energy across the state.
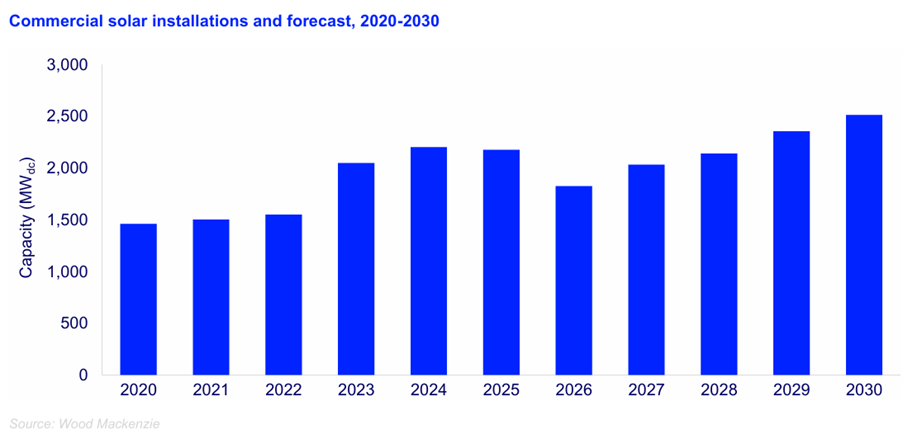
According to the report, the U.S. solar commercial market installed a capacity of 585 MW in Q2 2025, the second highest in history. States such as Illinois, New York, Massachusetts, and Pennsylvania recorded healthy volumes.
In 1H 2025, the sector installed 1 GW of solar installations, the largest first half ever. This increase was driven by projects under California’s NEM 2.0 program coming online. These projects accounted for over 90% of solar installations during this period.
Residential Solar
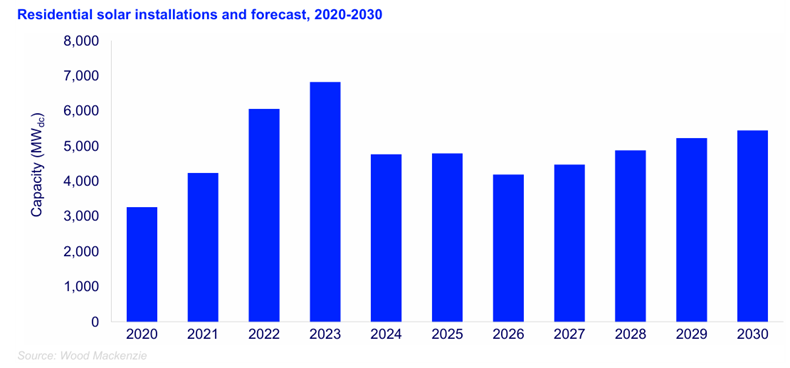
Residential solar installations during Q2 were just over 1 GW, with high interest rates and economic uncertainty suppressing demand. The bankruptcies of multiple solar companies also influenced the lower installation volumes.
The residential solar market added 1,064 MW of capacity, falling 9% YoY and 3% QoQ. The quarter witnessed the lowest capacity since Q2 2021, when it reduced to less than 1 GW. California, Florida, and Puerto Rico retained their lead in residential solar capacity rankings. California added approximately 275 MW, leading Florida by 200 MW.
In 1H2025, 33 states experienced a decrease in solar capacity from the previous year, resulting in a 12% YoY contraction.
Community Solar
The community solar segment installed 174 MW, a 52% YoY and a 34% QoQ decline, witnessing the lowest additions since Q1 2021. The segment’s volumes are reducing due to dwindling project pipelines in major markets with supportive policies. The report said no new markets are replacing these pipelines. Volumes for 1H 2025 decreased 36% YoY.
New York contributed heavily to the national contraction, with stagnating volumes during the quarter and capacities declining 56% YoY.
The report said that the U.S. has more than 9 GW of community solar in various stages of development as of Q2 2025. This development is likely to support the sector’s buildout through 2030.
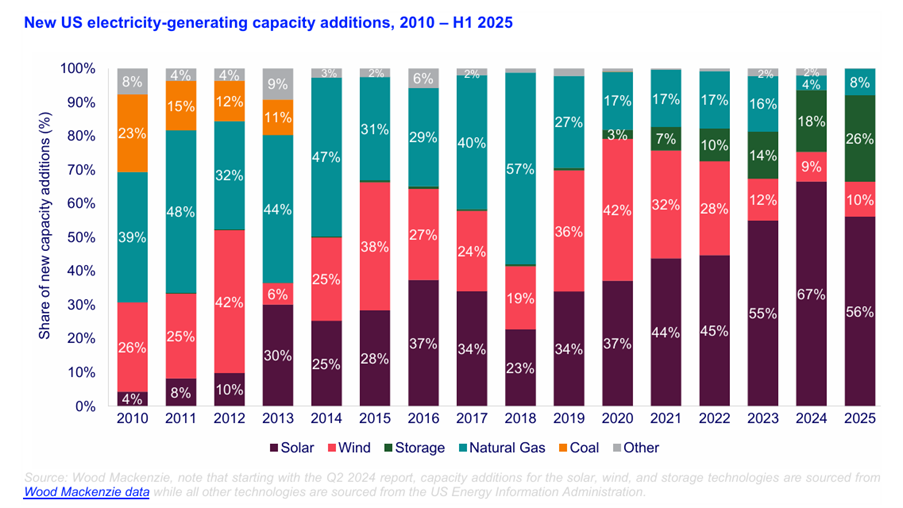
Photovoltaic solar accounted for 56% of all new electricity-generating capacity additions in the first half (1H) of 2025. It remained the U.S.’ dominant form of new electricity-generating capacity.
OBBBA Impact
The OBBBA (Budget Reconciliation Bill), signed on July 4, 2025, introduced sweeping changes to the U.S. energy policy landscape. The report stated that changes to the tax credit across several technologies, along with the new Foreign Entities of Concern (FEOC) requirements, will be an inflection point for multiple power sector trends.
Under the new provisions, the solar sector will no longer have access to Section 48E and 45Y tax credits after 2027, or the Section 25D tax credits (for customer-owned residential solar) after 2025.
Currently, projects starting construction on or before July 4, 2026, must come online in four years to earn the tax credits. However, solar projects beginning construction after this date must be commissioned by the end of 2027 to qualify for the 48E and 45Y credits.
The project cost share not allowed for payment to entities of concern will be 40% in 2026 and will increase by 5% every year to 60% from 2030 onwards.
Guidance and Permitting Uncertainty
On July 15, the Department of the Interior issued a memorandum stating that the Secretary of the Interior would personally sign off on numerous types of federal permitting approvals for solar and wind projects.
On August 15, the Treasury issued new guidance changing the definition of “beginning of construction” for solar and wind projects that are utilizing federal tax credits.
Earlier, projects could begin construction in one of the following pathways under the previous definitions: incurring at least 5% of the project cost (Five Percent Safe Harbor) or commencing onsite or offsite “physical work of a significant nature” (Physical Work Test). Projects using either pathway had to be commissioned by the end of the calendar year, four years post the commencement of the project’s construction.
The new guidance, effective September 2, largely maintains these requirements. However, the guidance has now removed the Five Percent Safe Harbor criterion for projects with capacities over 1.5 MW. These projects must now adhere to the Physical Work Test.
The Physical Work Test offers fewer bright-line assessments compared to the Five Percent Safe Harbor. The reduced assessments can create uncertainties for solar projects with planned construction commencement post-September 2.
FEOC Effect on Solar Manufacturing
The solar industry continued to grow in Q2 2025, with module manufacturing capacity reaching 55.4 GW. This growth exceeds the yearly solar installations when the factories are running at full capacity.
The increasing cost from the tariffs and higher labor and utility costs mean the 45X tax credits are crucial for U.S. solar manufacturers. Even though the 45X tax credits were maintained, the recent FEOC mandates could pose a risk to these credits.
Rise in Solar System Pricing
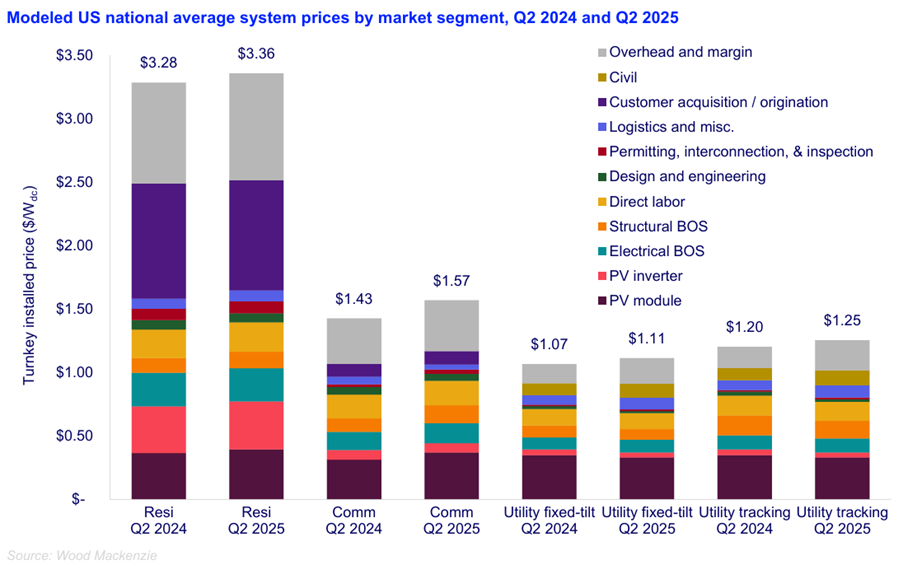
Residential solar system pricing rose 2% YoY. These costs increased in Q2 2025 following the government’s implementation of a 10% baseline tariff in April 2025. Baseline tariffs remained in effect even while a 90-day pause on reciprocal tariffs was announced. This contributed to cost increases throughout solar market segments.
The anti-dumping duty (AD) and countervailing duty (CVD) case on solar cells and modules from Cambodia, Malaysia, Thailand, and Vietnam, beginning in April last year and finalized in May 2025, pushed module prices by 13% YoY across distributed generation segments.
In August this year, the U.S. also initiated AD/CVD investigations against imports of crystalline silicon photovoltaic cells, whether or not assembled into modules, from India, Indonesia, and Laos.
Prices of residential systems averaged $3.36/W, increasing 2% over the previous year. Commercial system costs stood at $1.57/Wd, rising 10% YoY.
In Q2, utility-scale fixed-tilt and single-axis tracking system prices increased 4% YoY, reaching $1.11/W and $1.25/W, respectively. Engineering, procurement, and construction overhead, permitting, logistics, and miscellaneous costs rose 30% YoY on average.
Total utility-scale project system costs increased during the quarter compared to Q2 2024, despite a yearly average decrease of 10% in solar module and inverter prices.
Five-Year Forecast
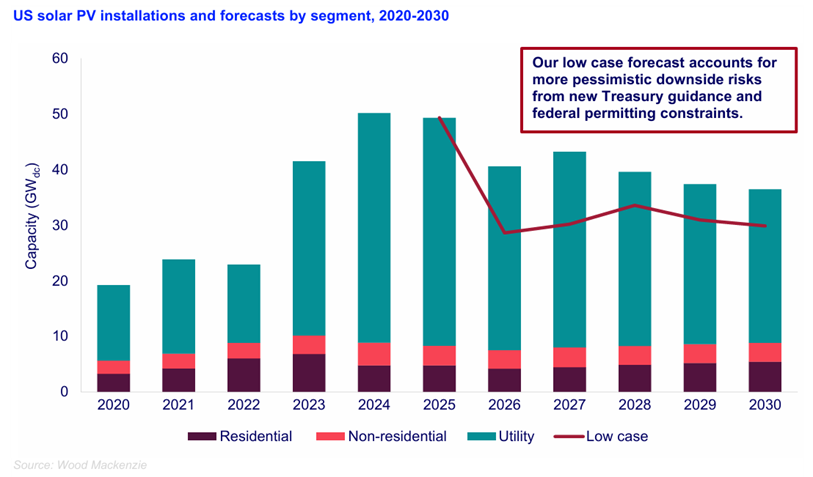
The report projects 246 GW of solar installations in the next five years.
New installations are projected to surge in 2027, with projects hurrying to meet the tax credit deadline.
Approximately 50 GW of solar installations are projected to begin construction before the end of 2025. Another 40 GW of projects are likely to start construction in 1H 2026.
The report’s base case broadly forecasts a 5% average annual decline in solar installations between 2025 and 2030, up from 2% in the Q1 2025 outlook.
Wood Mackenzie expects the OBBBA to also result in fewer new manufacturing facilities being commissioned in the coming quarters.
The residential solar segment is also expected to rush to install projects before the year’s end due to the expiry of 25D tax credits for it. However, the total installed capacity is unlikely to exceed the record-breaking volumes of 2024.
Commercial and community solar developers are projected to safe harbor equipment or commence physical work to the extent possible.
Between 2025 and 2030, the national commercial solar market is expected to grow at an annual average rate of 3%. Near-term growth is forecasted to remain steady through 2026 since most projects are already under construction or in interconnection queues.
States such as California, with its strong growth, is still witnessing projects under NEM 2.0 taking longer than initially forecasted to come online. Wood Mackenzie projects that the state’s commercial solar installations will continue to grow throughout 2025, with a dip in 2H 2026.
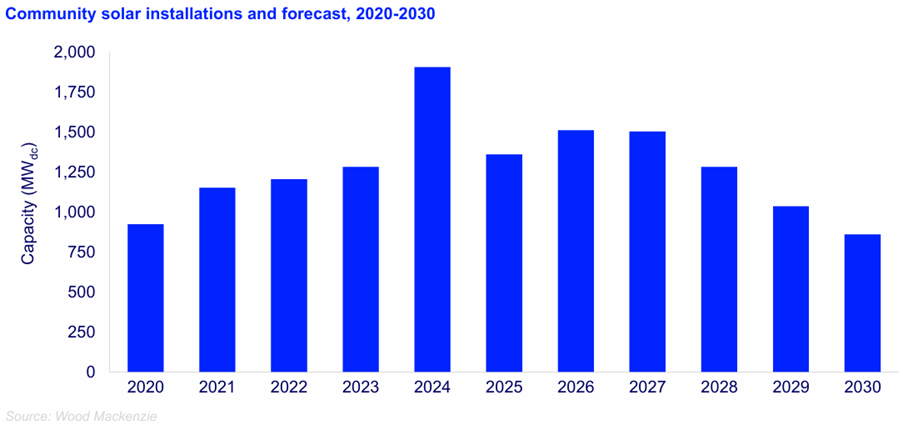
The report said the federal policy changes have reduced the community solar sector’s five-year outlook to 8% compared to Q2 2025.
The community solar market is forecasted to contract by an annual average of 12% through 2030. Multiple state markets have proposed community solar programs. However, stakeholders have struggled to finalize legislation so far. The early expiration of the Investment Tax Credit and the potential cancellation of the Environmental Protection Agency’s $7 billion “Solar for All” funding are expected to further complicate the design of frameworks for community solar in these states.
Despite the continued growth of successful community solar programs in Illinois, Maryland, and New Jersey, Wood Mackenzie projects a 29% market correction this year.
Wood Mackenzie’s base case projects 168 GW of added utility-scale solar capacity between 2025 and 2030.
Approximately 44 GW of planned capacity is projected to be affected by the DOI’s directive. States such as Arizona, California, Utah, and Nevada are likely to be the most impacted.
The report also presents a low-case solar development forecast in addition to its base-case forecast for the quarter to benchmark the possible outcomes of the recent policy developments. This forecast projects an 18% downside risk (44 GW).
In a more constrained permitting environment, the report forecasts a 30% decrease in the commissioning of solar projects in 2026 and 2027 compared to the base case scenario. The differential between the two forecasts reduces from 2028. In the low case, it averages 17% less capacity from this period onwards.
Increased demand for new energy supply and rising power prices are projected to strengthen market fundamentals in the long term. The report’s low case is 18% lower than the base case over the next five years.

