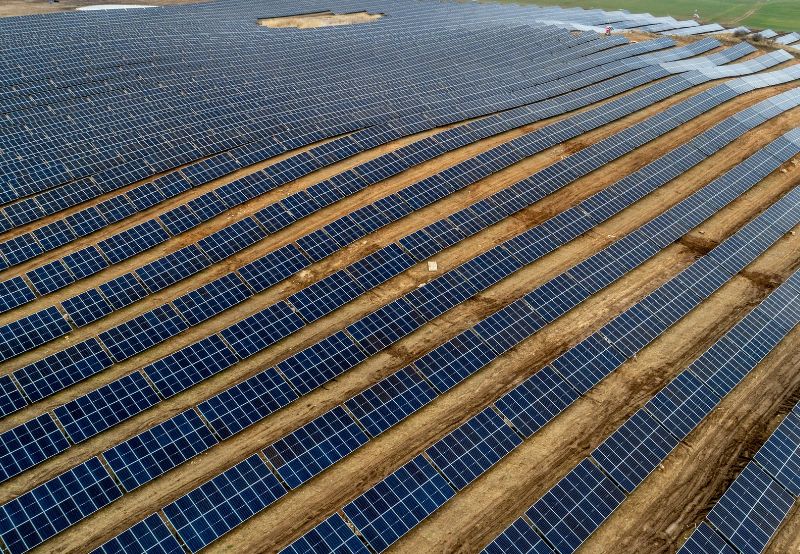
US Adds 3.63 GW of Utility-Scale Solar Capacity in Q1
Energy storage was the fastest-growing segment
June 5, 2026

Follow Mercom India on WhatsApp for exclusive updates on clean energy news and insights
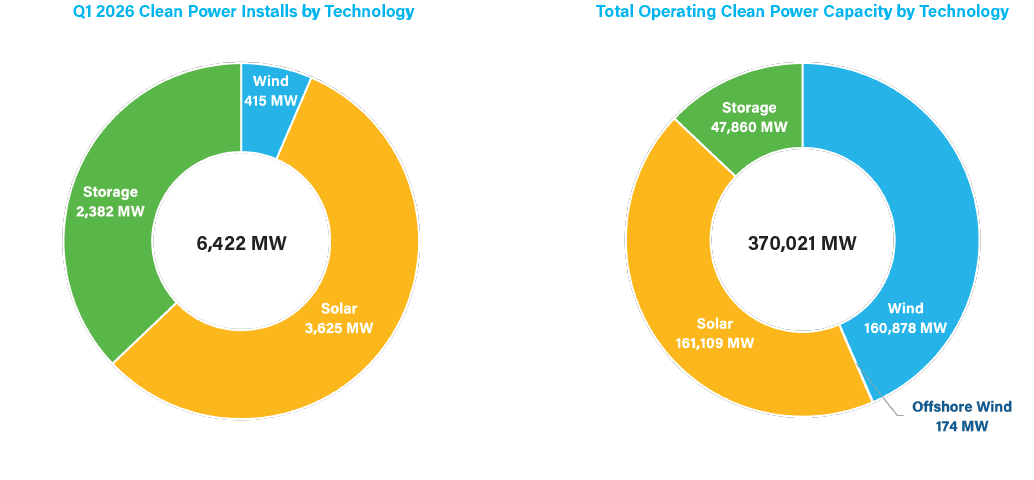
Utility-scale solar was the largest contributor to new clean power capacity in the U.S. in the first quarter (Q1) of 2026, adding 3.63 GW and accounting for 56% of all new clean power capacity additions, according to the American Clean Power Association (ACP).
During Q1 2026, 6.4 GW of new clean capacity was added to the grid, a 17% year-over-year (YoY) decline, according to ACP’s Clean Power Quarterly Market Report.
Despite the slow start, the cumulative U.S. clean power capacity reached 370 GW, enough to power nearly 80 million homes.
Solar Largest Clean Power Source
Solar continued to grow, with utility-scale solar accounting for the largest share of capacity additions in the quarter. Developers added 3.63 GW of capacity, making it the third-strongest first quarter for solar installations, behind only 2024 and 2025.
By the end of Q1, cumulative operational utility-scale solar capacity in the U.S. reached 161.11 GW. This pushed solar slightly ahead of land-based wind, which stood at 160.88 GW.
The report notes that utility-scale solar is now operational in all 50 states, the District of Columbia, and Puerto Rico, underscoring the technology’s broad geographic reach.
The largest solar project to begin operations in Q1 was the 250 MW Muskegon County Solar Project in Michigan.
Solar also remained the dominant technology in the development pipeline. At the end of Q1, utility-scale solar accounted for 103.4 GW in the clean power pipeline, or nearly 53% of total pipeline capacity.
Storage the Fastest-Growing Segment
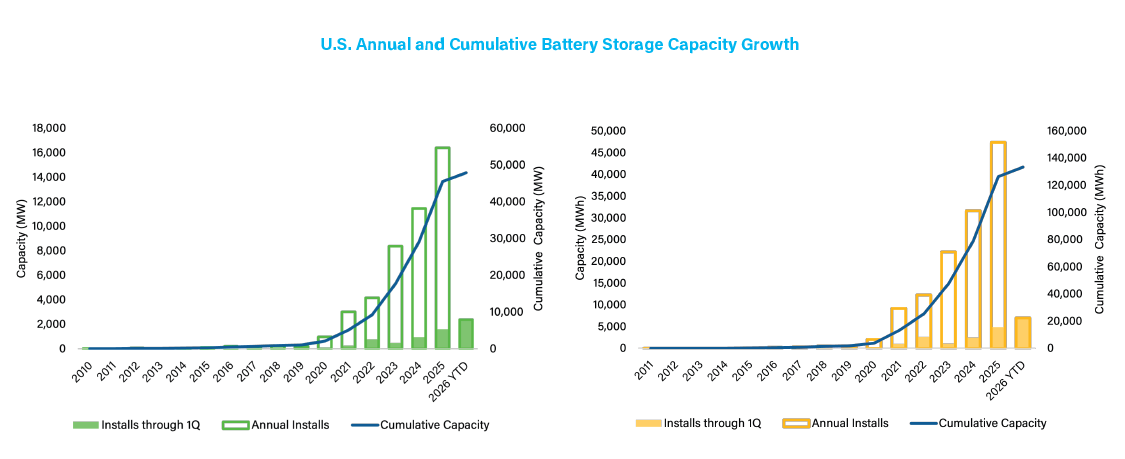
Battery storage was the standout performer in Q1 2026. Developers commissioned 40 new utility-scale battery storage projects, adding 2.38 GW of capacity and 6.99 GWh of energy to the grid. This was the strongest first quarter on record for battery storage additions, exceeding the previous Q1 record set in 2025 by 48%.
Storage accounted for 37% of all clean power capacity added during the quarter. Cumulative U.S. battery storage capacity reached 47.86 GW and 133.36 GWh. The report also states that 23.25 GW of battery storage capacity was under construction at the end of the quarter, up 13% from Q1 2025.
Battery storage reached 53.8 GW in the pipeline, up 17% from the previous quarter. Over the past two years, storage averaged a 7% quarterly pipeline growth rate, outpacing both land-based wind and solar.
Texas became the top state for operational battery storage in Q1 2026, overtaking California. With 714 MW of new storage additions, Texas further strengthened its role as the leading state not just for wind and solar, but also for storage.
Wind Remains Weak
Land-based wind had a slow start to 2026. Developers commissioned 415 MW of land-based wind capacity from three projects during the quarter, along with an additional 18 MW through repowerings. This made Q1 2026 the slowest first quarter for land-based wind installations since 2018.
The report attributes the slowdown partly to permitting delays and freezes affecting wind turbine development. It also notes that the land-based wind pipeline contracted by 2% quarter-over-quarter to 28.5 GW.
Despite the weak quarter, the report expects land-based wind deployment to improve later in the year. Several large projects are expected to come online, including the 3.5 GW SunZia Wind project in New Mexico. Ørsted’s 250 MW Badger Wind Project in North Dakota was the largest land-based wind project commissioned in Q1.
Offshore wind remained a much smaller part of the operating clean power base, with 174 MW online.
Texas Clean Power Leader
Texas remained the leader in the U.S. clean power market. The state added 1.57 GW of new clean power capacity, accounting for 24% of all capacity brought online during the quarter. Texas now ranks first in operational land-based wind, solar, and battery storage, and it also leads the pipeline for each of those technologies.
At the end of Q1, Texas had 96.4 GW of operating clean power capacity, placing it close to becoming the first state to cross the 100 GW threshold.
The development pipeline is concentrated in a few leading states and regions. Across all 50 states and Puerto Rico, the clean power pipeline reached 195.34 GW by the end of Q1.
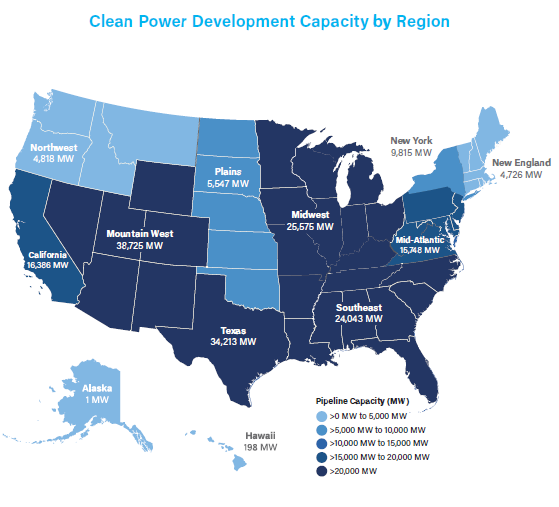
Texas led with 34.2 GW in development, followed by California and Arizona at roughly 16.4 GW each. Regionally, the Mountain West had the largest pipeline at 38.7 GW, followed by Texas at 34.2 GW and the Midwest at 25.6 GW.
PPAs the Dominant Offtake Model
Clean power procurement remained active in Q1 2026, though the total offtake announcements declined YoY. Purchasers announced 12.8 GW of clean power offtake arrangements in the quarter, down from 14.4 GW in Q1 2025 and 15.3 GW in Q1 2024.
PPAs accounted for 10.4 GW, or 81% of Q1 offtake announcements, and marked the strongest first quarter for PPA announcements on record.
Pipeline and Construction
The clean power pipeline reached 195.34 GW by the end of Q1, rising 4% QoQ and 6% YoY. Battery storage was the main driver of this growth, while solar saw modest growth and wind pipelines contracted.
At the end of the quarter, 89.41 GW of clean power projects were under construction across 604 projects in 48 states and Puerto Rico. Texas, Arizona, and California remained the top three states for construction activity, with 21.4 GW, 11.0 GW, and 9.6 GW, respectively. Together, these three states accounted for almost two-thirds of capacity under construction.
Risks and Challenges
The report cites that project delays are one of the most significant challenges. More than 6.4 GW of clean power capacity expected to come online in Q1 was delayed, adding to an existing backlog of delayed projects. In total, delayed capacity reached 59.5 GW.
The report states that this delayed capacity includes projects originally expected to enter service between 2021 and 2026. Of the backlog, 41% of delayed capacity is expected to reach commercial operation by the end of 2026, while 38% has expected commercial operation dates between 2027 and 2029.
Outlook
The report presents a market with strong fundamentals but near-term execution challenges. Clean power capacity has reached 370 GW, the development pipeline is nearly 195 GW, and storage capacity is growing rapidly. Solar is now the largest operating clean power technology, while battery storage is reshaping both quarterly installations and the future composition of the pipeline.
Land-based wind additions are expected to pick up later in the year, supported by major projects such as SunZia Wind.
According to an EIA report, utility-scale solar in the U.S. is expected to increase to 424 billion kWh by 2027, up from 290 billion kWh in 2025. Electric power generation is projected to grow by 1.1% in 2026 and 2.6% in 2027, reaching an annual total of 4,423 billion kWh.
The U.S. solar industry added 43.2 GW of new capacity in 2025, a 14% decline from 2024, according to a Wood Mackenzie report.


Rakesh Ranjan
More articles from Rakesh Ranjan.