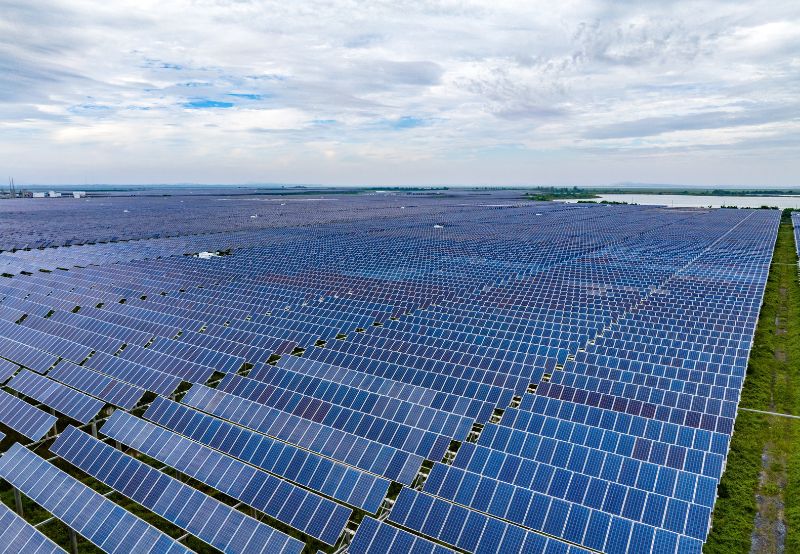
US Solar Industry Sees 14% YoY Decline in 2025 with 43.2 GW Installed

Utility-scale solar is expected to add 381 GW over the next 10 years

thumbnail

Follow Mercom India on WhatsApp for exclusive updates on clean energy news and insights


The U.S. solar industry added 43.2 GW of new capacity in 2025, a 14% decline from 2024, according to the U.S. Solar Market Insight 2025 Year in Review report released by Wood Mackenzie and the Solar Energy Industries Association (SEIA).

Even with the annual decline, solar remained the dominant source of new electricity generation, accounting for 54% of all new electricity-generating capacity added to the U.S. grid during the year. Solar and storage together made up 79% of all new capacity additions.

WoodMac Solar 1

Among states, Texas retained its position as the largest solar market in 2025, with 11,043 MW of installed capacity, followed by California with 4,665 MW. Indiana ranked third with 2,996 MW, rising sharply from 10th place in 2024. Florida and Arizona rounded out the top five state markets for annual solar installations.

Utility-Scale Solar

The utility-scale segment added 34.7 GW in 2025, down 16% year-over-year (YoY), making it by far the largest contributor to total annual additions. Installations through the first three quarters were broadly in line with 2024 levels, but the fourth quarter saw a sharp slowdown, with volumes falling nearly 40% YoY as developers delayed project completions and shifted focus to safe-harboring pipelines under revised tax credit rules.

Even so, forward-looking indicators remained strong. Transaction volumes for projects reaching financial close increased 26% YoY, while solar projects securing signed interconnection agreements rose 16% compared to 2024, suggesting stronger deployment in the near term.

Wood Mackenzie said the five-year outlook for utility-scale solar has increased 11%, with the segment expected to install 381 GW over the next 10 years.

Residential Solar

The report said the residential solar segment added 4,647 MW in 2025, down 2% from 2024. The first half of the year was weighed down by economic uncertainty, tariff concerns, and financier bankruptcies, while the second half saw stronger activity as installers rushed to complete projects before the Section 25D tax credit for customer-owned solar expired. Q4 2025 alone accounted for 1,301 MW, making it the segment’s strongest quarter since 2023.

California, Puerto Rico, and Florida led residential solar installations in 2025. Puerto Rico, in particular, recorded a standout year, with installations rising by more than 25%. However, the report expects the residential market to contract by 19% in 2026, before recovering gradually from 2027 onward.

Commercial Solar

The commercial solar segment added 2,345 MW in 2025, up 6% YoY, setting another annual record. California remained the leading commercial market, accounting for 39% of total national installations and posting 28% growth over the previous year. Commercial solar installations in the U.S. rose 11% quarter-over-quarter in Q4 2025, largely due to a wave of legacy NEM 2.0 projects in California coming online.

The report expects the commercial segment to contract by 13% in 2026 as the buildout of California’s remaining NEM 2.0 pipeline slows and developers transition to smaller projects under the state’s net billing tariff.

Community Solar

The community solar segment added 1,435 MW in 2025, a 25% decline from 2024. New York and Illinois remained the dominant markets, contributing 624 MW and 349 MW, respectively, or 68% of national community solar volumes. Although national additions declined, cumulative installed community solar capacity surpassed 10.1 GW in Q4 2025, crossing the 10 GW milestone.

New York remained the leading community solar market despite a 20% YoY decline, while Maine saw an 87% contraction, contributing heavily to the national slowdown.

Wood Mackenzie expects community solar installations to rebound 12% in 2026, supported by continued buildout in emerging markets such as New Mexico, Virginia, and Delaware.

Domestic Manufacturing

The report said 2025 was an important year for U.S. solar manufacturing. Domestic module manufacturing capacity expanded by more than 50%, reaching 65.5 GW by the end of 2025, up from 42.5 GW at the end of 2024. Cell manufacturing capacity also continued to grow, while wafer capacity came online in the U.S. for the first time since 2016. However, the report noted that actual output from domestic facilities remains well below total domestic demand.

System Prices

System pricing rose across most market segments in Q4 2025. Residential pricing was the exception, declining 1% year-over-year to $3.39/W. Commercial system prices increased 10% to $1.72/W, while utility-scale system prices rose 11% to $1.18/W for fixed-tilt systems and 14% to $1.35/W for single-axis tracking systems.

The report attributed the increases largely to higher raw material and equipment costs linked to tariffs, along with rising EPC overhead and margin.

WoodMac Solar 2

Outlook

Despite near-term policy and market uncertainty, Wood Mackenzie expects the U.S. solar market to remain on a long-term growth path. The report forecasts that cumulative installed solar capacity will rise from 279 GW at the end of 2025 to 769 GW by 2036, implying that the national solar fleet will nearly triple over the next decade. Over that period, the U.S. is expected to install 490 GW of new solar capacity, averaging more than 44 GW annually.

The report’s alternative scenarios show a roughly 100 GW spread in total solar deployment through 2036, depending on how uncertainties around FEOC guidance, tariffs, permitting, safe-harboring, and power demand growth play out. Under the high-case scenario, solar installations through 2036 would be 11% above the base case, while the low case would be 11% below it.

RELATED POSTS

Get the most relevant India solar and clean energy news.

RECENT POSTS