


US Residential Solar-Storage Adoption Jumps to 37% in 2025
October 6, 2026

Follow Mercom India on WhatsApp for exclusive updates on clean energy news and insights
The share of new residential solar systems paired with battery storage systems in the U.S. increased to 37% in 2025 from 25% in 2024, according to a new Lawrence Berkeley National Laboratory report.
California drove the increase, although storage attachment rates also grew in other states, with Arizona and Texas recording significant increases. Hawaii and California had the highest residential storage attachment rates in 2025.
Storage attachment rates for non-residential solar systems were considerably lower but increased to 11% of new installations in 2025.
The U.S. Distributed Solar and Storage 2026 Data Update includes approximately 5.3 million distributed solar systems through 2025, representing 93% of the U.S. market. It includes approximately 450,000 systems installed during 2025, also covering 93% of the total market for the year.
System Sizes and Storage
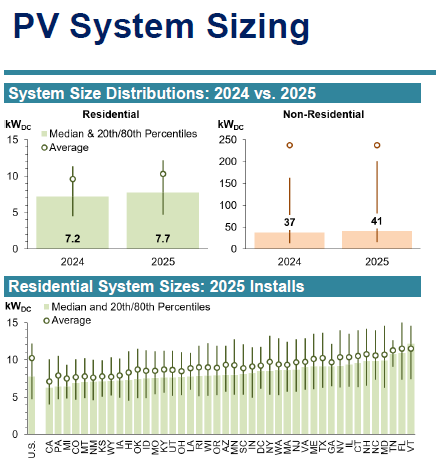
The median residential solar system size increased by 0.5 kW year over year to 7.7 kW in 2025, with most projects ranging from about 5 kW to 12 kW. California, which accounted for roughly half of the residential sample, had a relatively smaller median system size.
Non-residential systems had a median capacity of 41 kW, up from 37 kW in 2024. However, the segment had a wide range of system sizes, with the average reaching 238 kW.
The median battery storage capacity for residential solar-plus-storage systems remained unchanged at 13.5 kWh from 2024. However, median discharge capacity rose sharply from 6 kW to 11.4 kW, mainly because Tesla introduced the Powerwall 3, which has a higher discharge capacity than previous models.
For small non-residential projects, median storage capacity increased from 18.5 kWh in 2024 to 20 kWh in 2025, while median discharge capacity increased from 10 kW to 14 kW. Large non-residential systems saw median storage capacity decline from 886 kWh to 544 kWh, while median discharge capacity remained largely unchanged at around 250 kW.
Solar and Storage Costs
The median installed price of host-owned residential solar systems declined to $3.60/W in 2025 from $4.10/W in 2024, in inflation-adjusted terms.
Cash-purchased residential systems fell more sharply, with the median price dropping to $3/W from $3.60/W. Loan-financed systems remained considerably more expensive, although their median price decreased to $4.50/W from $4.80/W. 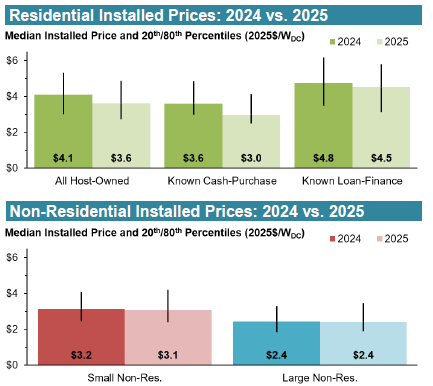
Median prices for small non-residential projects were largely unchanged at $3.10/W in 2025 compared with $3.20/W in 2024, while prices for large non-residential systems remained at $2.40/W.
Adding storage, however, substantially increased project costs.
For residential systems purchased with cash, the median installed price for solar-plus-storage systems was $5.10/W, compared with $3/W for standalone solar.
The difference was smaller for loan-financed residential projects. Solar-plus-storage systems had a median installed price of $5.3/W, compared with $4.5/W for standalone solar.
Among all host-owned residential projects, solar-plus-storage systems had a median installed price of $4.90/W, compared with $3.60/W for standalone solar.
For small non-residential projects, the median installed price was $5.10/W for solar-plus-storage, compared with $3.10/W for standalone solar. For large non-residential projects, the corresponding prices were $3.70/W and $2.40/W, respectively.
Technology Trends
The growing adoption of storage is also affecting the choice of solar power electronics.
The use of module-level power electronics (MLPEs), including microinverters and DC optimizers, declined significantly in residential projects in 2025, reversing the longer-term trend.
Berkeley Lab attributed the decline to rising storage attachment rates and increased use of Tesla Powerwall 3 systems, which integrate inverters and do not readily accommodate MLPEs in their typical DC-coupled configuration.
Over the longer term, median module efficiency has increased by an average of 0.4 percentage points annually.
Solar Adopters and Financing
Households installing solar in 2025 covered a broad range of income levels. The largest group, 38% of residential adopters, lived in census block groups with median household incomes between $50,000 and $100,000. Another 34% were in the $100,000-$150,000 range.
Around 14% were in the $150,000-$200,000 category, while 6% were in areas with median incomes below $50,000.
Third-party ownership (TPO) also continued to grow. The residential TPO share increased to approximately 40% in 2025 from 39% in 2024, after rising sharply from 21% in 2023.
For small non-residential systems, TPO increased to 16% from 13%, while the share for large non-residential projects remained roughly stable at 26%.
Lower-income solar adopters were more likely to use third-party ownership, while loans and cash purchases were more prevalent among higher-income customers.
Permitting
For residential standalone solar, the median period between a permit application and its issuance declined to six days from seven days in 2024. Solar-plus-storage residential projects had a median permitting period of three days, compared with six days in 2024.
Small non-residential projects had a median permitting period of 13 days, down from 21 days, while large non-residential projects took 51 days, compared with 52 days in 2024.
At the national level, paired solar-plus-storage projects had slightly shorter permitting timelines than standalone solar, although Berkeley Lab said this partly reflected differences in projects’ geographic distribution.
Over the longer term, permitting timelines have become more variable. For standalone residential solar, the 80th-percentile application-to-issuance period increased from nine days in 2000 to 25 days in 2025.
Long-Term Price Trends
Installed solar prices have fallen substantially over the past two decades. Inflation-adjusted prices fell from $9/W to $11/W, or about 70% to 80%, across customer segments.
The steepest declines occurred through 2014 and were primarily driven by falling module costs. Since then, prices have declined more gradually, averaging roughly $0.10/W to $0.20/W annually, driven primarily by changes in soft costs and other balance-of-system costs.
Soft costs include customer acquisition, installation labor, permitting and interconnection, certain financing fees, taxes, and profit. Together with other balance-of-system expenses, they accounted for roughly 80% of the median installed price of residential and non-residential solar systems in 2025.
Pricing also varied considerably among installers. Median installed prices among the 100 largest residential installers in the dataset ranged from approximately $2.4/W to $6.3/W in 2025. Roughly 60% had median prices below $4/W, almost a quarter were below $3/W, and about 10% exceeded $5/W.
More than a month after the U.S. introduced price floors and new tariffs on polysilicon products with its Section 232 proclamation, the median price for imported solar modules jumped by more than 40%, according to solar data company Anza.
The U.S. added 11.4 GW of solar capacity in the second quarter of 2026, a 45% year-over-year increase and a 43% quarter-over-quarter increase, according to a report by Wood Mackenzie and the Solar Energy Industries Association.


Rakesh Ranjan
More articles from Rakesh Ranjan.