


US Residential Solar Prices Rise 3% as Market Adjusts to Tax Credit Expiry
Median solar prices rose to $2.57 per watt in the first half of 2026
October 6, 2026

Follow Mercom India on WhatsApp for exclusive updates on clean energy news and insights
Rising utility rates strengthened the case for U.S. residential solar, while prepaid third-party ownership (TPO) financing improved affordability for price-sensitive customers after the federal residential solar tax credit expired at the end of 2025, according to EnergySage’s 23rd Home Electrification Marketplace Report.
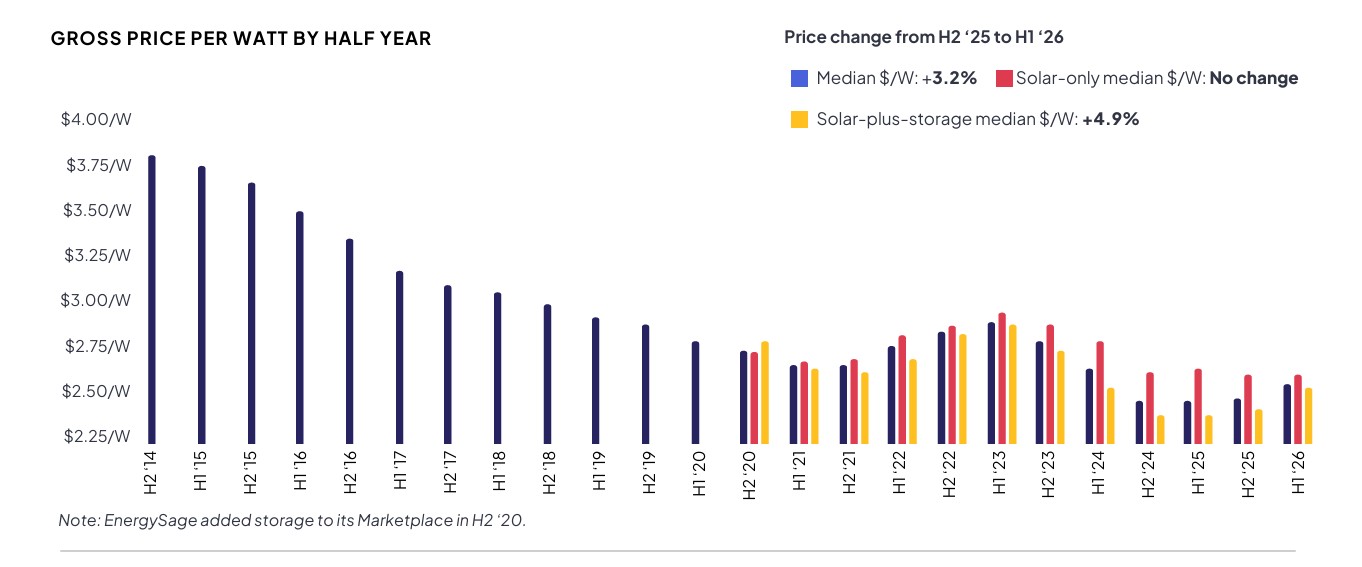
Median solar prices rose to $2.57 per watt in the first half (1H) of 2026, up 3.2% from the pre-tax-credit period in the second half (2H) of 2025. For a median-sized 12 kW solar installation, this translated to a cost of $30,712 before incentives.
While solar-only pricing fell 1% to $2.62/W between 2H 2025 and 1H 2026, solar-plus-storage prices, which exclude the battery price, rose 5% to $2.55/W during the period.
According to the EnergySage report, money was the biggest factor in solar decision-making. About 70% of contractors said saving money was the primary reason their customers chose solar installations, while 63% cited cost or pricing as the biggest driver of lost sales.
The U.S. added 11.4 GW of solar capacity in the second quarter (Q2) of 2026, a 45% year-over-year and a 43% quarter-over-quarter increase.
Financing Options
Following the expiration of the 30% federal tax credit, financing options like prepaid TPO are helping bridge the affordability gap. They offer significant savings as compared with cash purchases or loans. Standard power purchase agreement (PPA) rates also remained below grid electricity rates in every qualifying state, making flexible financing options an important way for installers to retain price-sensitive customers.
The share of installers quoting TPO options on EnergySage rose from about 14% at the beginning of 1H 2026 to roughly 41% by the end of the period, nearly tripling in six months. EnergySage said some of the increase reflected the growing availability of TPO products on its marketplace, while TPO-financed projects can continue to qualify for federal incentives through 2027.
In 1H 2026, prepaid TPO products recorded the lowest upfront cost per kilowatt-hour among the financing options available on EnergySage. Residential solar projects financed through prepaid leases were 39% cheaper than cash purchases, while prepaid PPAs were 57% cheaper.
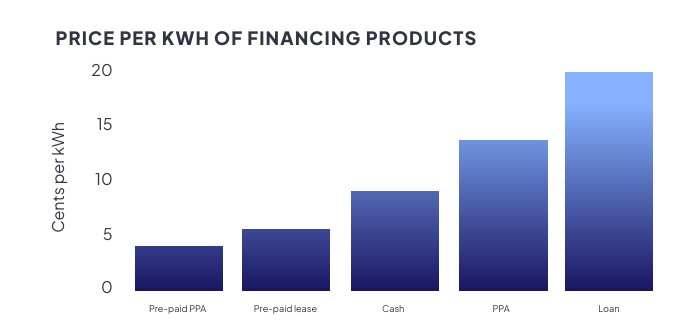
Compared to loans, upfront costs for prepaid leases and PPAs were 72% and 80% lower per kWh, respectively. Cash purchases remained about 33% more cost-effective than traditional PPAs, even after the 30% tax credit expired.
High Power Costs Push Storage Demand
Rising electricity rates due to aging infrastructure, higher demand, electrification, and utility policy changes are strengthening the case for residential storage. As grid power becomes more expensive, bill savings could make storage increasingly attractive to homeowners and support higher battery attachment rates.
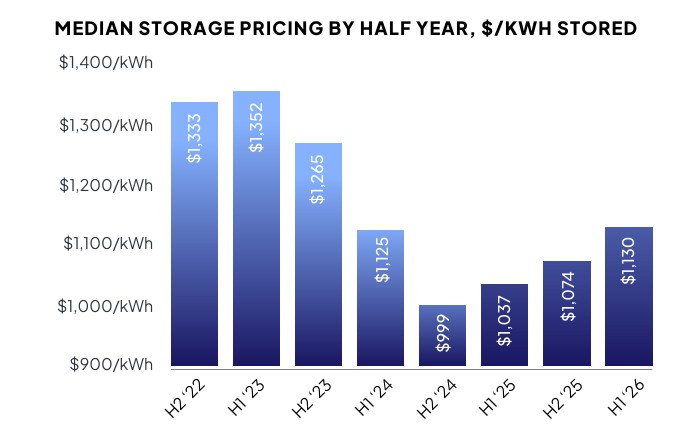
Median residential battery storage prices in the U.S. rose 5% during 1H 2026 to $1,130/kWh, up 9% year-over-year. Storage prices were also 13% above the market low of $999/kWh recorded in 2H 2024.
EnergySage attributed the increase to trade and supply chain disruptions that affected the U.S. market in 2025. Batteries face stricter Foreign Entities of Concern requirements than solar panels to maintain eligibility for federal tax credits, making battery prices more susceptible to increases.
Consumer interest in battery storage increased to 76% in 1H 2026 from 73% in 2H 2025. However, the storage attachment rate fell to 31% from 39%, highlighting the gap between consumer interest and actual purchases.
Among contractors surveyed for the report, 64% cited price as the primary reason customers did not add battery storage to their solar systems. Among customers interested in storage, 37% cited savings on utility bills as their primary motivation, followed by self-supply at 35% and backup power at 28%.
Storage pricing and attachment rates varied by state. Battery prices declined 4% each in Texas, Arizona, and Florida, 1% in Hawaii, and 18% in Utah. In contrast, prices increased 11% in North Carolina. Battery attachment rates reached 100% in Hawaii and 68% in Texas, while California’s attachment rate declined to 58% from 71%.
At the end of June 2026, the U.S. battery storage development pipeline stood at 56,416 MW, comprising 23,590 MW under construction and 32,826 MW in advanced development. The pipeline increased 21% from Q2 2025.
Installer Costs and Diversification
Labor costs continued to increase for U.S. residential solar installers, with 74% of contractors reporting higher hourly labor rates over the previous year. Another 21% reported no change, while 5% reported a decline.
Contractors estimated that equipment accounted for an average 36% of the cost of an installed solar system, followed by installation labor at 22%. They estimated net profit at about 17%, overhead and administrative costs at 11%, sales at 7% and marketing at 6%, among others.
Amid these cost pressures, contractors are expanding beyond solar and storage installations. About 58% of contractors said their primary growth strategy over the next three years was to add products or services adjacent to solar and storage. This compared with 46% that planned to increase installation revenue in their existing markets and 29% that planned to expand geographically.