Mercom Insider

US Commissioned Over 70 New Clean Energy Manufacturing Facilities in 2025: Report

The US added nearly 30 new utility-scale solar manufacturing facilities in 2025

May 28, 2026

/
thumbnail

Follow Mercom India on WhatsApp for exclusive updates on clean energy news and insights


The U.S. brought online over 70 new domestic clean energy component manufacturing facilities in 2025, according to a report by the American Clean Power.

Source: American Clean Power

Of these, over 55 manufacture primary supply chain components for the renewable energy sector.

In the first three months of 2026, the U.S. added 10 manufacturing facilities, half of which produce primary components.

Cumulatively, the U.S. has added over 825 domestic clean energy component manufacturing facilities across all 50 states, with large clusters in Texas, Tennessee, Georgia, Ohio, and North Carolina.

More than 300 U.S. factories are producing the core components of clean energy projects, including wind blades, towers, nacelles, solar modules, and batteries.

In the last five years, the number of such facilities has surged by 37%, with growth projected to reach nearly 50% by the end of the decade.

The report stated that U.S. domestic manufacturing capacity has expanded to produce solar and battery storage systems to meet domestic demand, and that the U.S. continues to lead in wind nacelle and tower manufacturing.

The rapid growth in the domestic manufacturing sector also led to a 33% decline in solar imports and a 10% decline in storage imports from last year.

By 2030, the report projects that the U.S. will be able to meet the demand from the critical battery storage supply chain domestically.

The clean power manufacturing sector contributed $31 billion to the U.S. GDP annually and supported the growth of 215,000 jobs.  The construction of these facilities also supported 207,000 jobs.

Clean energy factory workers earn 35% more than the average American worker.

By 2030, over 950 manufacturing facilities are expected to support 374,000 jobs and contribute $55 billion to the GDP.

Solar Manufacturing

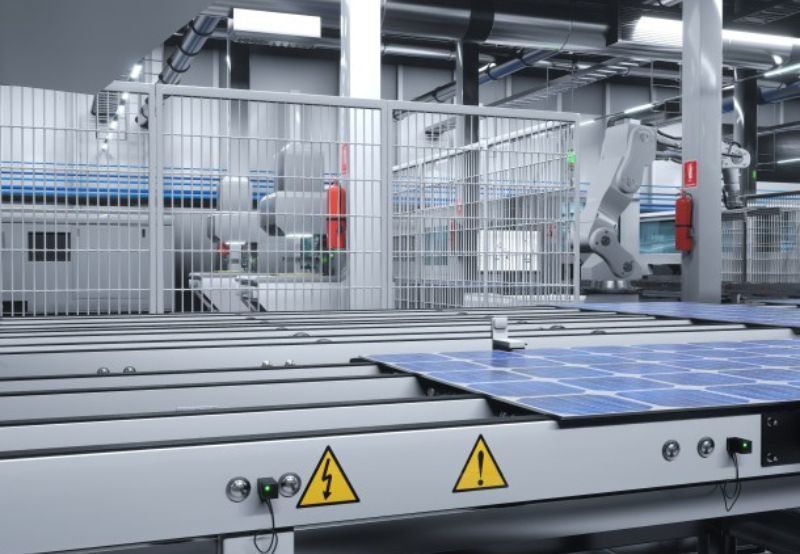
Nearly 30 new utility-scale solar manufacturing facilities started production in 2025. Solar tracker and inverter production represented the majority of the other new facilities.

Source: American Clean Power

In 2025, more than 140 facilities across 30 states produced primary components such as modules, cells, ingots, and wafers, as well as trackers and racking systems.

Over the past five years, the number of operational solar primary-component manufacturing plants in the U.S. has grown by nearly 150%.

Module manufacturers commissioned 15 GW of new capacity, bringing total annual capacity to 63 GW/year. By the end of the decade, total module capability is expected to exceed 85 GW/year.

The report said that C-Si module production using domestic cells, combined with domestic thin-film capacity, could meet annual solar demand by 2027.

If all planned facilities reach full capacity, domestic supply could cover 50% of c-Si module manufacturing demand.

The anticipated ingot and wafer capabilities will more than double by the end of the decade. However, they will still be less than domestically manufactured cell demand and even less than total solar demand.

The nearly 70 online tracker and racking component manufacturing facilities are spread across 25 states.

According to the report, there are over 50 additional manufacturing sites in 20 states that are either under construction or announced across the solar supply chain. Of these sites, 40 are manufacturing primary solar components.

Solar Imports

In 2025, solar imports were down an estimated 33% from 2024 levels, driven by ongoing antidumping and countervailing duty (AD/CVD) investigations and the onshoring of domestic manufacturing.

In March 2026, the Office of the United States Trade Representative initiated a Section 301 investigation into structural excess capacity and production in manufacturing, with India among the economies under review.

Domestic manufacturing capacity for thin-film solar modules met the bulk of installation demand in 2025, with the remainder covered by imports from India and Southeast Asia.

American c-Si module manufacturing capacity in 2025 met more than half of the installation demand. Southeast Asian imports supplied most of the demand unmet by domestic capacity.

Nascent U.S. cell manufacturing is estimated to meet about 1% of manufacturing demand in 2025, with Southeast Asia and Korea serving as the largest cell suppliers to the growing domestic module manufacturing demand.

Solar inverters are sourced globally, with the most substantial volume coming from Southeast Asia, the EU, and Japan. It is estimated that over one-sixth of solar inverters were sourced domestically in 2025. Developers are actively seeking to increase the share of domestic inverters in 2026 and beyond.

Battery Manufacturing

In the U.S., more than 30 new battery manufacturing facilities came online in 2025, pushing the industry to over 140 facilities. Of these, more than 80 facilities in 28 states produce primary components for the BESS supply chain.

The U.S. added a record 9.7 GWh of energy storage capacity in the first quarter of 2026, up 32% year-over-year, according to a joint report by Solar Energy Industries Association and Benchmark Mineral Intelligence.

As of 2025, seven BESS systems and integrated storage system manufacturing facilities were online, with three more expected by the end of 2026.

The U.S. now has a cumulative capacity of 75 GWh/year for LFP module and battery system manufacturing. Expansion of operational battery manufacturing facilities could push the total over 95 GWh, with the potential to exceed 150 GWh/year if all announced facilities are commissioned by the end of 2026.

Additionally, the U.S. now has a production capacity of over 28 GWh/year of processed lithium carbonate.

The report anticipates that at least five announced lithium extraction projects could add 140,000 metric tons of lithium carbonate equivalent to the domestic landscape by 2030. The cumulative processed graphite capacity is expected to exceed 120 GWh/year by the end of the decade.

In 2025, the U.S. also met over one-third of demand with domestic inverters and is expected to meet installation needs by 2030.

There are over 100 additional sites across 28 states that are either planned or under construction.

Battery module, cell, and processed lithium capacity could fulfill demand by year-end 2026. Domestic active anode material and processed graphite could meet storage demand as early as 2028.

However, the cathode active material capacity is projected to meet less than 7% of demand by 2030.

Wind

Over $25 billion has been invested in the offshore wind supply chain, including ports, vessels, and staging facilities.

Six offshore wind vessels were placed in service in 2025, with another five vessels under construction. Each vessel represents an average investment of $155 million.

Domestically manufactured or refurbished offshore wind vessels now total over 30.

The success of new plate manufacturing marks the start of an even larger opportunity to expand steel fabrication in the country. If all potential offshore wind capacity comes online by 2040, it would create a demand for 1.6 million tons of steel per year, one-third of the entire U.S. energy sector’s steel requirement.

Employment

In 2025, operating clean energy manufacturing facilities generated almost $16 billion in earnings, representing over $61 billion in spending across the U.S. economy.

Among domestic clean energy impacts, the solar supply chain represents almost 50% of total employment. Clean energy manufacturing directly employs 50,000 workers.

Jobs associated with the operation and maintenance of online clean energy manufacturing facilities offered salaries about 36% above the national average.

The construction of new or expanded clean energy manufacturing facilities in 2025 supported 207,000 jobs. If they materialize, manufacturing facilities that have been announced but have not begun construction would add another 107,100 jobs.

If all under-construction and expected clean power manufacturing facilities come online, the total industry would support almost 373,000 jobs, 70% more than the existing 215,000 jobs.

Together, they would generate almost $28 billion in earnings, contribute $55 billion to GDP, and represent over $107 billion in spending across the U.S. economy.

RELATED POSTS

Get the most relevant India solar and clean energy news.

RECENT POSTS