Solar, Storage Account for 91% of New US Power Capacity in Q1 2026
The U.S. added 7.8 GW of solar capacity in the first quarter
June 11, 2026


Follow Mercom India on WhatsApp for exclusive updates on clean energy news and insights
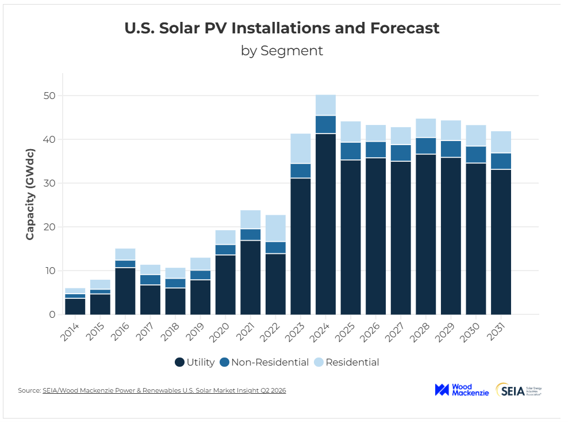
The U.S. solar industry installed 7.8 GW of capacity in the first quarter (Q1) of 2026, a 27% decline from Q1 2025 and a 42% decline from Q4 2025, according to a report by Wood Mackenzie and the Solar Energy Industries Association (SEIA).
Solar and storage accounted for 91% of all new electricity-generating capacity additions in the U.S. during the quarter, with solar contributing 60%.
As of 2025, the U.S. solar industry had over 200 GW of safe-harbored capacity supporting near-term installations as of 2025. The report expects utility-scale pipelines of 216 GW to 240 GW from safe-harbored projects, which could sustain deployment through 2030 after accounting for attrition.
The U.S. Treasury Department and the Internal Revenue Service had issued partial guidance in February on the Prohibited Foreign Entity provisions under the One Big Beautiful Bill Act. The report said the industry expects full guidance in 2027, with further clarity before the July 4, 2026, safe harbor deadline unlikely. The uncertainty is significant for solar manufacturers, as multiple China-linked companies are reorganizing under U.S. ownership.
U.S.-manufactured solar modules catered to nearly 70% of 2025 solar installations. Module manufacturing in the U.S. expanded considerably, but solar cell manufacturing capacity was limited to 3 GW.
Domestic module producers continued to depend heavily on imported cells. Imports from India, Indonesia, Laos, Malaysia, Thailand, and Vietnam accounted for 78% of U.S. cell imports.
Last May, the United States International Trade Commission (USITC) voted to conclude that domestic solar module manufacturers suffered material injury from imports of crystalline silicon photovoltaic cells, whether or not assembled into modules, from four Southeast Asian countries.
In July, the Alliance for American Solar Manufacturing and Trade filed new anti-dumping and countervailing duty petitions with the USITC and the U.S. Department of Commerce against imports of crystalline silicon photovoltaic cells, whether or not assembled into modules, from India, Indonesia, and Laos.
Flat Growth
Despite strong demand, U.S. solar additions are expected to remain flat and average 43 GW annually over the next five years because of challenges related to permitting, interconnection, equipment, trade, and tax credits, the report said.
Utility-Scale Solar
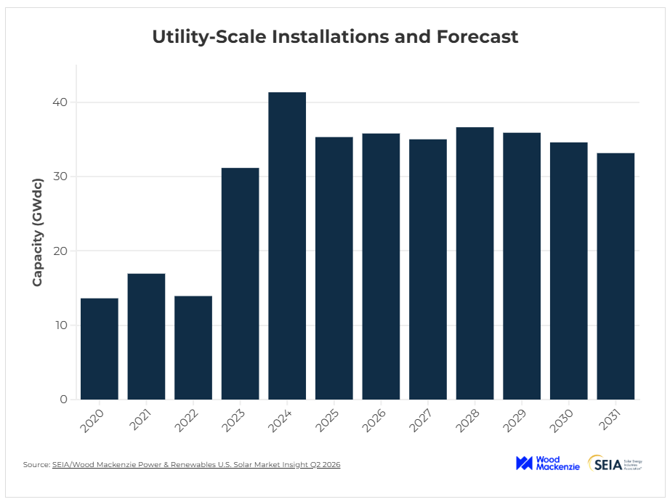
The U.S. utility-scale solar segment added 5.9 GW of capacity in Q1 2026, down 34% year-over-year. Slower Q1 installations are expected to be offset by strong project execution and higher contracting activity, with most 2026 projects scheduled for commissioning in Q2 and Q4.
The report noted that project execution remained strong during the quarter, with nearly all projects completed on schedule or two to three months ahead of plan. Utility-scale solar installations were mainly concentrated in Texas, Florida, Indiana, and Ohio.
Contracting activity rose 15% year-over-year, with 6.3 GW of capacity signed in Q1 2026. Texas led contracting activity, supported largely by offtake agreements from data and technology companies.
The utility-scale segment is expected to add 211 GW from 2026 to 2031. Permitting remains a near-term constraint, affecting approximately 30% of the early-stage solar pipeline.
Residential Solar
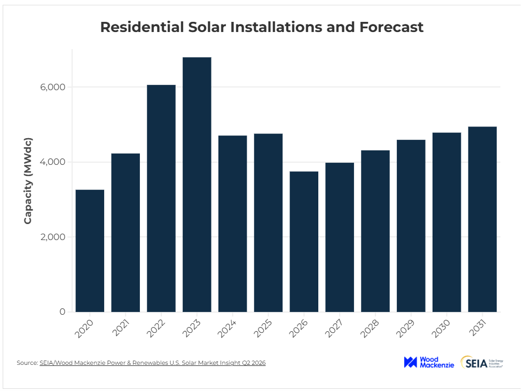
The residential solar segment added 1,179 MW in Q1 2026, a 6% year-over-year (YoY) increase and a 15% quarter-over-quarter (QoQ) decline.
Installations were supported by overflow interconnections and demand from customer-owned projects that had to be installed, though not necessarily interconnected, by the end of 2025 to qualify for the Section 25D tax credit.
California, Florida, and Illinois led residential solar installations during Q1 2026. Florida and Illinois recorded their strongest quarters since the end of 2024.
The report revised the residential market outlook downward. Capacity is expected to contract by 21% in 2026 due to the bankruptcy of the second-largest national installer, limited availability of tax equity, and updated permitting data.
The segment is expected to return to growth in 2027 and expand at an average annual rate of 6% through 2031, supported by third-party ownership projects and prepaid third-party ownership offerings.
Commercial Solar
The U.S. commercial solar segment installed 523 MW in Q1, its second-highest Q1 capacity addition on record. Installations declined 4% YoY and 25% QoQ.
California led the segment with 201 MW of installations, accounting for 38% of national additions, driven by NEM 2.0 projects. The report said such installations are expected to decline sharply because the deadline for these projects ended in April 2026.
Illinois added 49 MW, supported by incentives such as the Illinois Shines program. Pennsylvania installed 40 MWdc, driven by businesses seeking to offset rising retail electricity rates.
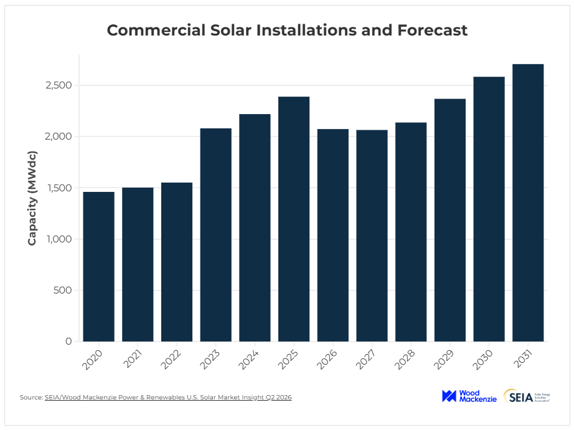
The U.S. commercial solar market is expected to contract in 2026 due to California’s transition to a new tariff regime and lower additions in legacy markets such as New York and Massachusetts. The segment is projected to remain flat in 2027 before rebounding from 2028 to 2030 as developers commission safe-harbored projects.
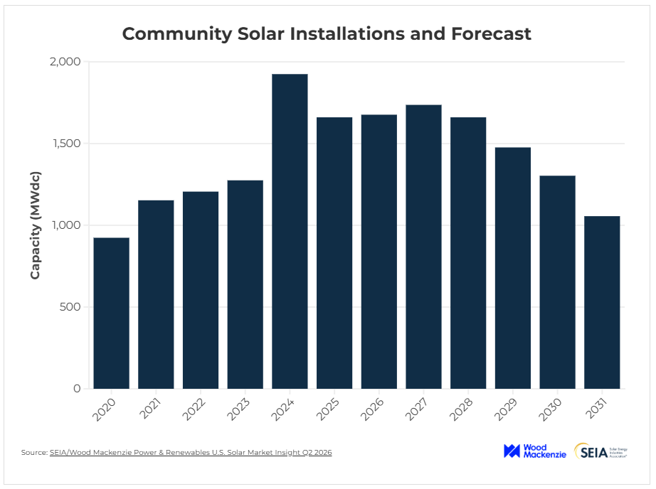
Community Solar
The U.S. community solar market installed 247 MW in Q1 2026, down 4% YoY and 67% from the previous quarter.
New York recorded 61 MW of new installations, a 46% drop from the same period last year and the largest annual decline among state markets. Strong project pipelines and improved interconnection queue efficiency are expected to support near-term growth.
The report said the national community solar market is expected to grow 1% in 2026 to nearly 1.7 GW, supported by an 8.2 GW project pipeline.
Top developers safe-harbored equipment for their pipelines before the December 2025 deadline, partly reducing exposure to FEOC risks.
According to the report, expanding solar programs in Illinois and the Mid-Atlantic region, including New Jersey and Virginia, are expected to drive growth in 2026 and 2027. Improved queue efficiency in key markets such as Illinois and New York, along with program expansions in New Jersey and Virginia, increased the five-year outlook by 13% from Q4 2025.
The market is expected to contract by an average of 7% annually through 2031 as projects eligible for the investment tax credit are completed, state markets mature, and project economics weaken. Developers are increasingly exploring small utility-scale solar and distribution-connected storage projects.
Solar System Pricing
U.S. solar system prices declined over the last year across all market segments in Q1 2026, except in the commercial segment, where prices increased 4% YoY.
Residential system prices declined 7% YoY, while utility-scale system prices fell 3% for projects using fixed-tilt and single-axis trackers. The decline was primarily driven by lower module prices across all segments and reduced customer acquisition costs in the residential market.
Module prices for distributed generation projects in the residential and commercial segments fell by over 20% YoY. Utility-scale module prices declined 8%. The decline was driven primarily by the repeal of tariffs under the International Emergency Economic Powers Act, which ranged from 20% to 50% for some sourcing regions, including Indonesia and Laos.
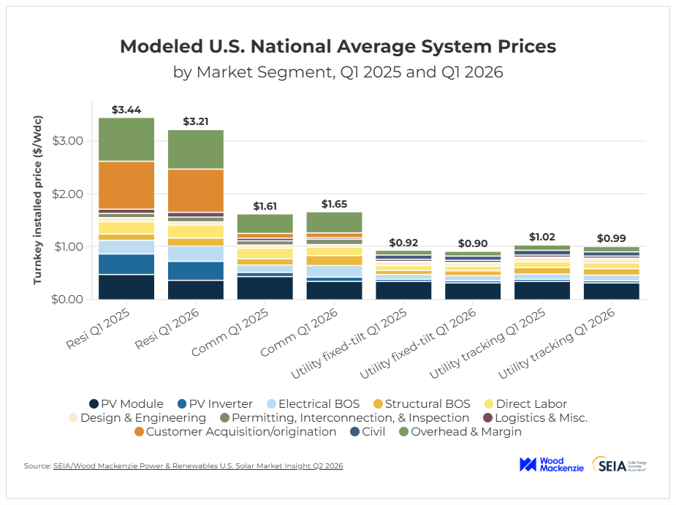
Commercial system prices rose 4% YoY to $1.67/W, even as module prices fell to $0.34/W in Q1 2026 from $0.43/W in Q1 2025. Equipment costs for electrical and structural balance-of-system components increased 60% over the previous year in the commercial segment, driven by Section 232 metal tariffs and higher costs from domestic suppliers.


Parth Shukla
More articles from Parth Shukla.