


Global Renewable Capacity Must Double to Reach 11.2 TW by 2030: Report
Maintaining 2025 growth would leave a 600 GW shortfall by 2030
September 23, 2026

Follow Mercom India on WhatsApp for exclusive updates on clean energy news and insights
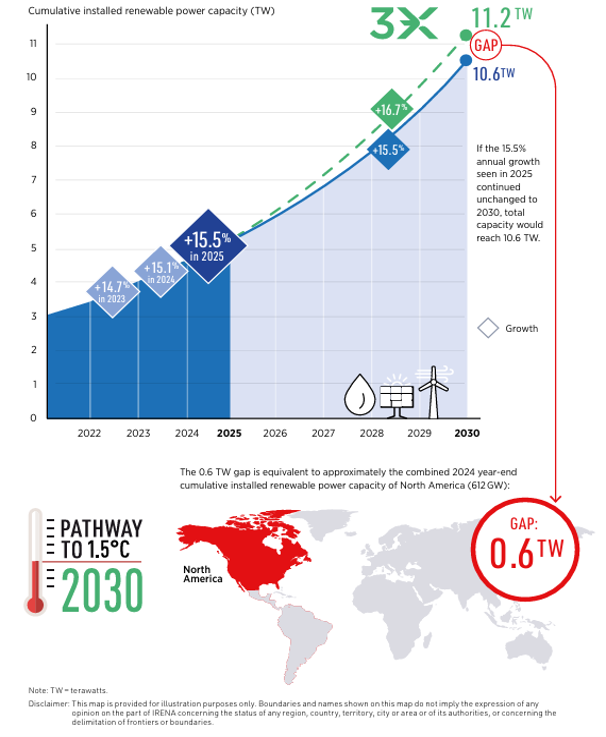
Global renewable energy capacity additions must more than double to reach 11.2 TW by 2030 and meet the UAE Consensus target of tripling renewables from 2022 levels, according to a report by the International Renewable Energy Agency (IRENA), the COP31 Presidency, and the Global Renewables Alliance.
Worldwide renewable energy capacity reached 5,155 GW at the end of 2025, following an annual addition of 693 GW and bringing renewables’ share of the global installed power mix to 49.5%.
However, maintaining the 2025 growth rate would leave the world about 600 GW short of the target.
Renewable Energy
About 6.02 TW of renewable energy capacity must be added over the next five years to reach 11.2 TW, requiring average annual additions of around 1.2 TW and a compound annual growth rate of 16.7%. The projected shortfall has narrowed from an earlier estimate of 900 GW.
Solar accounted for 46.3% of global renewable capacity in 2025 at 2,388 GW, followed by hydropower at 1,296 GW and wind at 1,291 GW. Solar led new additions to renewable capacity at 513 GW, followed by wind at 158 GW. Variable renewables accounted for 96.9% of the net additions.
Under the tripling pathway, variable renewables are projected to exceed total fossil fuel capacity by 2030 and account for about 62% of the global installed power capacity, comprising 42% solar and 20% wind energy.
To meet the UAE Consensus target, installed wind capacity must rise by another 2,243 GW by 2030, which requires average annual additions of 449 GW. Hydropower additions must average 34 GW annually through 2030.
Renewable deployment remained concentrated, with Asia, Europe, and North America accounting for 86% of the global capacity in 2025. Asia accounted for 514 GW, or 74% of global additions. The contribution of G20 countries hit 4.6 TW and must reach 9.4 TW by 2030. The European Union added 70 GW to reach 779 GW and must average 97 GW annually to reach 1.3 TW by 2030.
Renewables remained cost-competitive, with 90% of new utility-scale capacity generating cheaper power than new fossil fuel alternatives. The global weighted average levelized cost of electricity was $33/MWh for onshore wind, $44/MWh for solar, and $78/MWh for offshore wind. Renewables avoided 8.4 Gt of carbon dioxide emissions and $480 billion in fossil fuel costs in 2025.
Global battery storage additions reached approximately 112 GW, or 307 GWh, in 2025, up 48% from 76 GW in 2024. China, the U.S., and Europe accounted for nearly 85% of the annual additions. Fully installed battery energy storage system costs fell nearly 30% from 2024 to 2025 and 95% since 2010, reaching $140/kWh. Global pumped hydro storage additions reached a record 10.3 GW, taking cumulative capacity to 160 GW.
Solar paired with storage accounted for nearly 25% of utility-scale solar capacity commissioned globally in 2025. Solar plus storage costs at 95% reliability fell from more than $100/MWh in 2020 to $54/MWh to $82/MWh in 2025. Global hydrogen electrolyzer capacity exceeded 4 GW after more than 2 GW was added in 2025, although the 2030 project pipeline fell about 25% over the past year.
Energy Efficiency
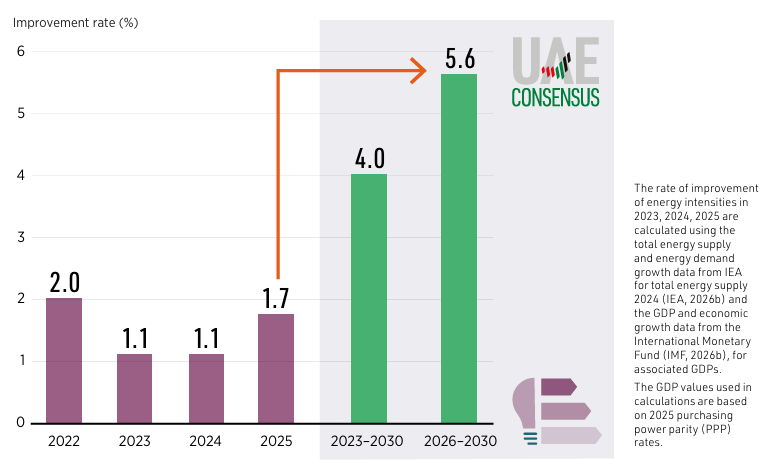
Energy intensity improved 1.7% in 2025, below the UAE Consensus target of 4% annually. IRENA expects an annual improvement of 3% between 2026 and 2030. To meet the 2030 target, however, energy intensity needs to improve by 5.6% annually over the next five years. Electrification must increase from 23% of global final energy consumption in 2023 to around 30% by 2030.
Electric vehicles (EVs) accounted for 26% of new car sales globally in 2025. Global EV stock reached about 78 million, while annual sales rose 25% year-over-year to 22 million. Buildings accounted for around 30% of global energy demand and more than half of electricity consumption in 2024. Global residential heat pump sales declined 2% to around 14.1 million units in 2025, according to the International Energy Agency.
Energy Transition Investments
Global investment in renewable power capacity reached $625 billion in 2025. Solar accounted for $417 billion, while wind attracted $155 billion. Meeting the 2030 tripling target requires $8.6 trillion from 2026 to 2030, averaging $1.7 trillion annually.
From 2026 to 2030, grids and flexibility will require an average annual investment of up to $1 trillion, including about $800 billion for grid expansion and modernization and up to $200 billion for energy storage. Energy efficiency investment must average $3.2 trillion annually through 2030, compared with $369 billion in 2025.
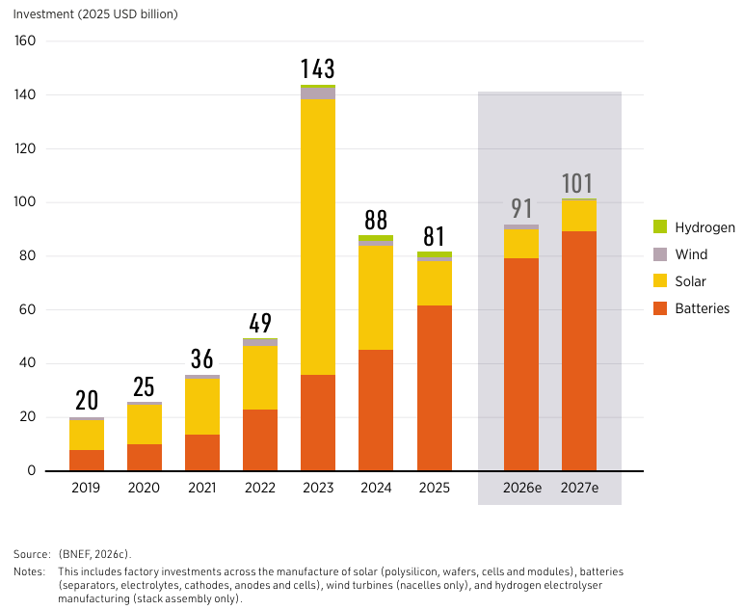
Investments in solar, wind, battery, and hydrogen manufacturing fell 7% to $81 billion in 2025. China held 89% of solar, 88% of battery, 76% of wind nacelle, and 66% of electrolyzer assembly capacity. India accounted for nearly one-fifth of global solar manufacturing investment, with investments exceeding $3 billion in 2025.
Clean energy manufacturing investment continued to shift outside China, with other economies accounting for 23% of the investments in 2025, up from 20% in 2024. Global battery factory investment rose 36% to $61 billion. More than 800 GWh of lithium-ion batteries were traded globally.
Grid Infrastructure
Around 2,500 GW of renewable, storage, and large load projects at advanced stages are awaiting grid connections globally. IRENA estimates annual grid investment of about $902 billion will be required through 2030, compared with roughly $450 billion invested in transmission and distribution grids in 2025. Grid-enhancing technologies and flexible connection arrangements could unlock capacity for 1,200 GW to 1,600 GW of advanced-stage projects.
Grid constraints also increased renewable curtailment in several markets. Germany, France, and the Netherlands curtailed a record 3.9 TWh of renewable generation, while the UK curtailed 10 TWh of wind generation in 2025. China’s wind and solar curtailment reached 5.7% and 5.2%, respectively. India had awarded connectivity to 107 GW of projects awaiting integration, while transmission delays led to about 300 GWh of renewable curtailment on the interstate grid in the first quarter of 2026.
Policy and Market Reforms
As of June 9, 2026, 120 third-generation Nationally Determined Contributions (NDC 3.0), representing 119 countries and the European Union and covering 77% of global emissions, had been submitted to the United Nations Framework Convention on Climate Change (UNFCCC). Of these, 88% mentioned expanding renewable energy deployment and 67% included quantified renewable energy targets.
Globally, 256 competitive auctions for renewables, storage, and clean fuels were completed from January 2025 to May 2026, awarding 230.8 GW of capacity. Another 164 auctions were planned or announced. India amended its Renewable Consumption Obligation framework in September 2025, with compliance options including direct renewable electricity consumption, renewable energy certificates, virtual power purchase agreements, and buyout mechanisms.
IRENA reported last year that in 2024, 581.9 GW of new renewable energy capacity was added globally, representing a 15.1% annual growth rate and a 0.7% increase over 2023.


Parth Shukla
More articles from Parth Shukla.