US Added Record 26 GW of Renewables Power in 2020: Report
Wind, solar, and battery storage power represent 78% of the country’s new power installations in 2020
August 7, 2021


The American Clean Power Association released its first Clean Power Annual report, which captures key industry trends and rankings from 2020. The report showed that wind, utility solar, and battery storage power capacity crossed 170 GW in the United States due to a record 26 GW of new clean power installed in 2020.
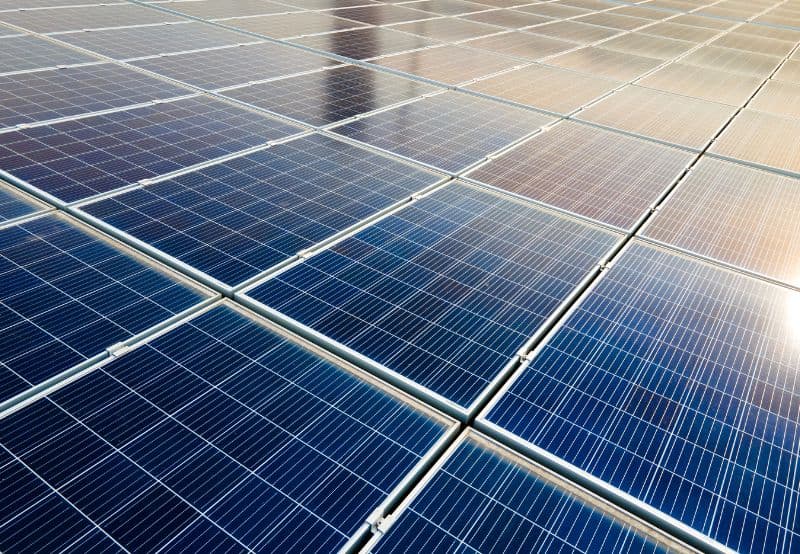
The installations include 16,836 MW of land-based wind projects, 8,894 MW of utility-scale solar projects, and 760 MW of battery storage projects. Combined wind, solar, and battery storage power represent 78% of new power installations in 2020.

“The Clean Power Annual report is a testament to the record growth and investment across the renewable energy industry in the United States today. The energy transition is well underway as we aim to meet important climate targets and create good-paying American jobs,” said Heather Zichal, CEO of the American Clean Power Association. “The clean power industry is helping to rebuild the U.S. economy while combating the climate crisis. We hope this report can be a tool and resource as our industry drives innovation and job-creating investments in every American state,” Zichal added.
Currently, 10.7% of the electricity in the U.S. comes from clean power technologies, which is the same as powering over 50 million homes.
Clean power and the U.S. economy
Wind turbine technicians and solar installers are the country’s first and third fastest-growing occupations, respectively, with over 415,000 Americans across the country directly employed in clean energy jobs. This is expected to increase to over 1 million clean energy jobs by 2030 if the industry momentum and supportive policies continue.
The projects commissioned in 2020 represent around $39 billion in investment. Growth is continuing across the industry, with a further almost 90 GW of clean energy projects underway, representing an investment of more than $120 billion. Since 2005, an estimated $334 billion have been infused in project investment in the clean energy sector across the country.
In 2020, the clean power industry paid around $1.7 billion in state and local taxes and nearly $800 million in lease payments to landowners across the country.
Corporate buyers announced over 10 GW of new clean power contracts and power purchase agreements in 2020. Corporate buyers (non-utilities) contracted 10,417 MW of clean power capacity, almost the same amount as utilities at 10,854 MW. The non-utility share of contracted clean power capacity achieved an all-time high of 46%.
The report predicted that the economic impacts from the growing U.S. offshore wind industry are likely to continue as the East Coast experiences a surge in growth. 9 GW of offshore wind capacity is in advanced development along the Eastern seaboard. By the end of 2020, Connecticut, Maryland, Massachusetts, New Jersey, New York, Rhode Island, and Virginia had issued procurements or state targets totaling nearly 30 GW of offshore wind capacity.
State-wise installations
The report shows that two-thirds of U.S. states run at least 1 GW of operating wind, utility solar, or battery storage capacity.
Texas took the lead with 37,443 MW of installed cumulative clean power capacity, followed by California with 20,354 MW, Iowa with 11,394 MW, Oklahoma with 9,395 MW, and Kansas with 7,058 MW.
Texas also topped the clean power capacity additions the year before with 6,320 MW, followed by California with 2,193 MW, Florida with 1,267 MW, Iowa with 1,218 MW, and Oklahoma with 1,182 MW.
Texas led all states in land-based wind capacity additions with 4,137 MW and utility-scale solar capacity additions with 2,044 MW. California led in battery storage additions, with 573 MW.
In electricity generation, Texas led all states by generating over 100 million MWh of renewable electricity in 2020.
Impact on environment
In 2020, wind and solar projects offset 327 tons of CO2 – the equivalent of taking off 71 million cars from the streets. Wind and solar projects also avoided 291,000 tons of sulfur dioxide and 245,000 tons of nitrogen oxide. These clean air benefits delivered an estimated $16 billion $41 billion in long-term health benefits in 2020 due to decreased mortality, respiratory issues, and other pollutant-related health impacts.
According to a new report by Lawrence Berkeley National Laboratory of the U.S. Department of Energy, Renewables Portfolio Standard policy drove 45% of capacity addition in the U.S. since 2000.
Earlier, BloombergNEF and the Business Council for Sustainable Energy, in their report ‘Sustainable Energy in America Factbook’, reported that a total of 33.6 GW of wind and solar capacity was added to the US’s grid in 2020. The contribution of renewables in the US grew 11% year over year in 2020, with a 15% jump in output from wind and solar and a 5% increase in hydropower generation.


Arjun Joshi
More articles from Arjun Joshi.RELATED POSTS
Daily News Wrap-Up: Application Process for ALMM Inclusion and Renewal

Australia Adds 5.9 GW of Renewable Capacity to the Grid in 2023
POWERGRID Wins Contracts to Evacuate 18 GW of Renewable Energy